Distributed Tracing in Sitecore .NET SDK with OpenTelemetry
In a recent post I shared how to setup OpenTelemetry in an ASP.NET application.
Now let’s explore how we can optimize that setup in a Sitecore .NET SDK based application.
Custom request name
Because of the way Sitecore’s SDK is architected using a fallback controller, all routes will pass through the same controller. The side effect of that with tracing is that all activities will be annotated with the same display name.
In the Startup.cs where you add OpenTelemetry to the IServiceCollection, you can enrich your tracing through AddAspNetCoreInstrumentation options. Below example shows how you can set tags, like the route as an additional tag, but also how to change the display name from the default **sitecoreRoute to a more useful name including the request method and path.
public void ConfigureServices(IServiceCollection services)
{
    services.AddOpenTelemetry()
        .WithTracing(tracing =>
        {
            tracing.AddSource("Sitecore.RenderingHost");
            tracing.AddAspNetCoreInstrumentation(options =>
            {
                options.EnrichWithHttpRequest = (activity, httpRequest) =>
                {
                    activity.SetTag("http.route", httpRequest.Path.Value);
                };
                options.EnrichWithHttpResponse = (activity, httpResponse) =>
                {
                    if (activity.DisplayName.Contains("**sitecoreRoute"))
                        activity.DisplayName = $"{httpResponse.HttpContext.Request.Method} {httpResponse.HttpContext.Request.Path}";
                };
            });
        });
}
Additional activities
By default, all requests will be traced. Although this is useful, you will most likely want more granular information to see processing times for specific methods and/or integration API calls.
Additional activites are tracked through System.Diagnostics. In .NET you can create activities which will automatically be exposed as part of your tracing.
To do so, you can create new Activities as part of an ActivitySource. An ActivitySource performs best when created only once during the lifetime of a .NET application, so you will want to create this as a Singleton.
Below example shows an InstrumetationSource which can be added to the IServiceCollection as a Singleton.
using System;
using System.Diagnostics;

namespace Sitecore.Rendering
{
    public sealed class InstrumentationSource : IDisposable
    {
        internal const string ActivitySourceName = "Sitecore.RenderingHost";

        public InstrumentationSource()
        {
            string? version = typeof(InstrumentationSource).Assembly.GetName().Version?.ToString();
            this.ActivitySource = new ActivitySource(ActivitySourceName, version);
        }

        public ActivitySource ActivitySource { get; }

        public void Dispose()
        {
            this.ActivitySource.Dispose();
        }
    }
}
In your application you can retrieve the InstrumentationService and use the ActivitySource to start a new Activity.
All you need to do is retrieve the ActivitySource from the InstrumentationSource Singleton, and then start a new activity with a useful name. For useful observability you will want to define a name that clearly separates processes that take place in your application, like service and method specific names.
using Activity activity = _activitySource.StartActivity("AccountService.LogInAsync");
Additionally, you can add extra tags to each activity as shown below.
// Add tags (attributes) to the span for better context
activity.SetTag("order.id", order.Id);
activity.SetTag("order.customer_id", order.CustomerId);
activity.SetTag("order.total_amount", order.TotalAmount);
activity.SetTag("order.item_count", order.Items.Count);
Result
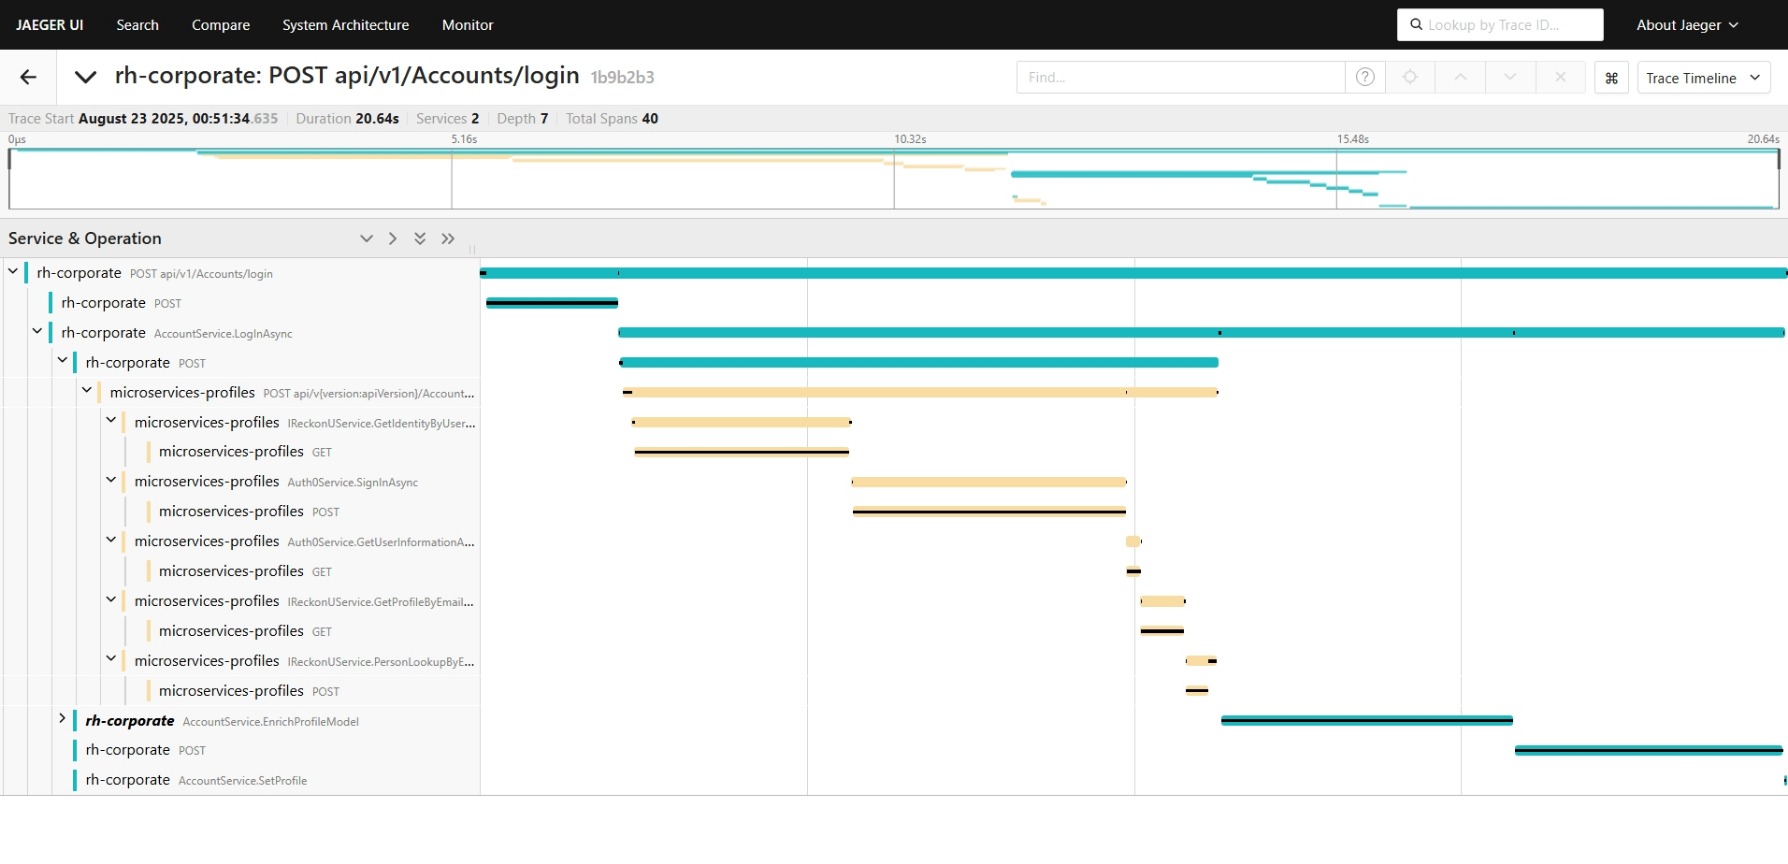
Applying these tracing enhancements in your application will greatly improve the observability of it. It will allow you to more easily find performance hotspots and debug issues on hosted environments.
When applying this to tracing visualization in Jaeger, it may look something as below example.
